

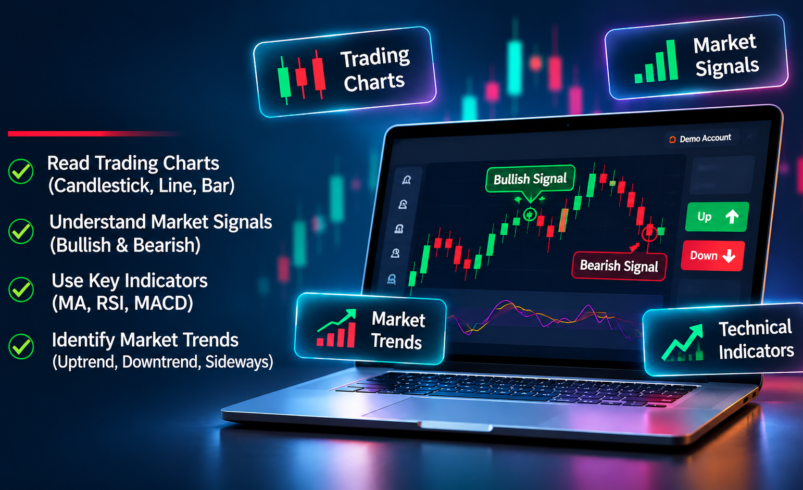

Understanding trading charts and market signals is an important step for anyone interested in digital trading. Charts provide visual information about price movements, while market signals help traders identify potential trends and changes in market conditions. For beginners exploring the Quotex platform, learning how these tools work can support better market analysis and more informed decisions.
What Are Quotex Trading Charts?
Quotex trading charts display the historical price movements of financial assets over selected time periods. These charts help users observe market trends, identify price fluctuations, and understand how an asset has performed.
Common chart types include:
- Line Charts: Display price movements through a continuous line, making overall trends easier to identify.
- Candlestick Charts: Show opening, closing, highest, and lowest prices within a specific period.
- Bar Charts: Present price information using vertical bars that represent market activity during a selected timeframe.
Among these options, candlestick charts are particularly useful because they provide detailed information about price movements.
Understanding Market Signals on Quotex
Market signals are indicators or observations that suggest possible changes in an asset’s price direction. They are generally based on technical analysis, historical market data, and price patterns.
For example, a bullish signal may indicate potential upward price movement, while a bearish signal may suggest possible downward movement.
However, market signals are not always accurate. Sudden economic developments, unexpected events, and changing market conditions can influence price movements.
Therefore, traders should treat signals as analytical information rather than guaranteed predictions.
Important Technical Indicators to Understand
Technical indicators help users analyze chart data and identify potential market trends. Some commonly used indicators include:
1. Moving Average (MA)
A moving average smooths historical price fluctuations and helps identify the general market direction. It can make upward and downward trends easier to recognize.
2. Relative Strength Index (RSI)
RSI measures price momentum and helps identify potentially overbought or oversold conditions. These readings may suggest changes in market momentum but do not guarantee reversals.
3. Moving Average Convergence Divergence (MACD)
MACD compares moving averages to evaluate trend direction and momentum. Traders often observe changes in its lines and histogram to identify possible market shifts.
How to Identify Market Trends
Recognizing market trends is another essential part of chart analysis. Markets generally experience three conditions:
- Uptrend: Prices form progressively higher highs and higher lows.
- Downtrend: Prices form lower highs and lower lows.
- Sideways Trend: Prices fluctuate within a relatively narrow range without a clear direction.
Understanding these patterns helps users interpret price behavior and recognize changing market conditions.
Support and resistance levels can also provide useful context by highlighting areas where prices have previously struggled to move lower or higher.
Tips for Beginners Analyzing Quotex Charts
Beginners should focus on learning chart fundamentals before attempting advanced strategies. Start by studying candlestick patterns, understanding different timeframes, and observing how technical indicators respond to price changes.
Using a demo account can provide an opportunity to practice chart analysis without risking actual money. It is also important to remember that chart timeframes and trade expiry times serve different purposes.
Avoid relying entirely on automated signals or a single technical indicator. Digital options trading involves substantial financial risk, and even detailed technical analysis cannot eliminate the possibility of losses.
Conclusion
Learning to understand Quotex trading charts and market signals helps beginners develop a clearer understanding of price movements, market trends, and technical indicators. By studying candlestick charts, recognizing support and resistance levels, and practicing technical analysis, users can improve their knowledge of how digital trading platforms work.
Consistent learning, careful observation, and awareness of financial risks are essential when interpreting market information. No chart pattern or trading signal can guarantee a profitable outcome.